
Micro-frontends bring the concept of microservices into the world of front-end development.
Instead of a single monolithic application, the front end is broken down into individual components, each managed by independent teams. This approach aims to divide a large problem into many smaller, more manageable parts. As such, the micro-frontend architecture is particularly well-suited for large-scale applications. The complexity of an individual micro-frontend is significantly lower than that of a monolith, and the components are loosely coupled. This allows teams to implement new features more easily and release them independently of one another.
The individual components of a micro-frontend must be brought together in what is known as composition. There are various strategies and technologies available for this. One long-standing method is client-side composition using iFrames. In this approach, each micro-frontend is rendered within its own iFrame. iFrames offer strong encapsulation by default, and there are native methods available for communication between iFrames. Additionally, teams are free to choose their own technology stack when using iFrames. On the downside, iFrames are known for performance issues, and ensuring a consistent user experience can be a major challenge. Another challenge associated with iFrames is the potential for memory leaks, which can arise from certain bad practices during development.
What are Memory Leaks?
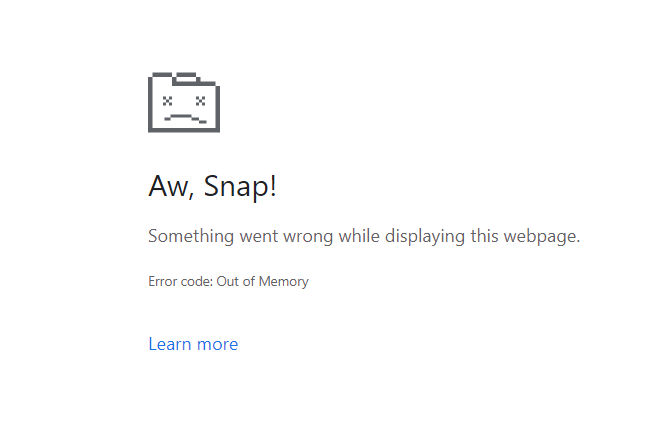
Memory Leaks refer to errors in memory management. In a memory leak, memory is allocated but not released again. This causes memory usage to continuously increase, which can lead to application errors or even crashes. In the browser, a memory leak may eventually result in the following error message:
Fortunately, developers do not need to manually manage memory allocation and deallocation when programming their websites. This task is handled by the garbage collector. The garbage collector automatically detects which areas of memory are no longer needed and releases them accordingly.
In the Chrome browser (and most other browsers as well), all objects are kept in memory as long as they are reachable from the garbage collector root (GC root). Objects are connected to each other via references. One such reference might be storing a Window object in a variable. If this variable is never cleared, the Window object will never be released from memory.
Memory Leaks in Micro-Frontends
In most applications, the browser’s garbage collector works very well. Objects are automatically released from memory when they are no longer needed, and developers rarely need to manage memory explicitly.
However, caution is advised when working with micro-frontend architectures—especially when individual micro-frontends are dynamically added and removed in the form of iFrames. This can quickly lead to memory issues.
The shell application in a micro-frontend architecture is responsible for managing and composing the individual iFrames. Often, these components are stored in variables to simplify access. In such cases, there is a reference from the shell application to the child iFrames. If this reference is not properly discarded, the iFrames remain in memory, which can lead to memory leaks.
Memory Leaks in Micro-Frontends: Event Listeners as a Risk Factor
It’s not only the implementation of the shell application that requires caution. Memory leaks can also occur within the individual micro-frontends themselves. A common cause is event listeners. If a child application registers an event listener on the shell application, it creates a reference. If this reference is not properly removed, it can also lead to memory leaks.
In most cases, child applications should not directly access the shell application. To avoid errors, an explicit interface should be used between the shell and the iFrames. The postMessage() method is a native way to enable communication between iFrames.
If direct access to the shell application cannot be avoided, care must be taken to properly remove event listeners and other references. A suitable trigger for cleaning up these references is the beforeunload event on the window object.
Debugging Memory Leaks
There are many tools and applications available for debugging memory leaks. However, one of the most useful tools is already built into the Chrome browser: the Heap Profiler. It can be found in the Memory tab of the Chrome DevTools. The Heap Profiler helps developers investigate memory issues and identify which objects are consuming how much memory.
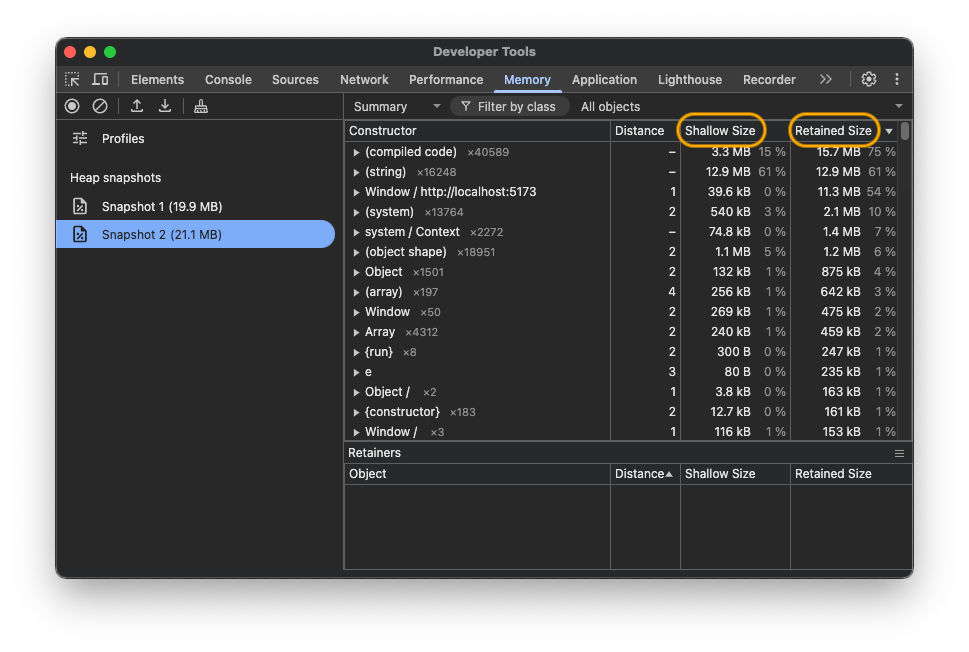
In a heap snapshot, two sizes are displayed for each object: Shallow Size and Retained Size. Shallow Size represents the amount of memory occupied by the object itself. Retained Size indicates the memory that would be freed if the object and all of its dependent objects were deleted. This occurs once the object is no longer reachable from the GC root.
There are many different types of GC roots. Most of them are not relevant to the developer.
However, when debugging memory leaks in micro-frontends, two types of roots are particularly important: the global window object, and the document’s DOM tree. Both types of GC roots exist per iFrame.
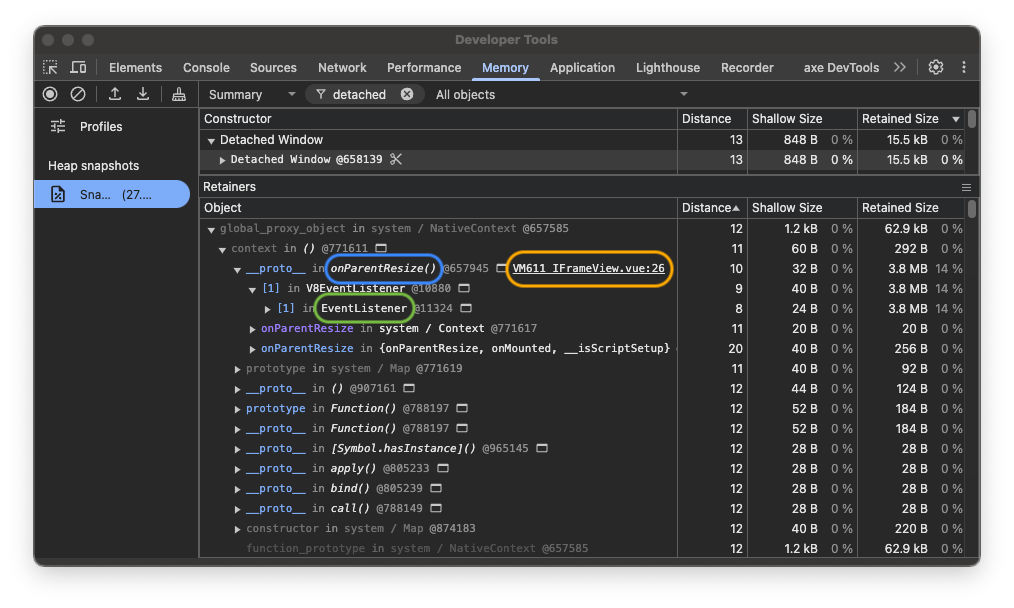
Identifying and Analysing Memory Leaks with the Heap Profiler
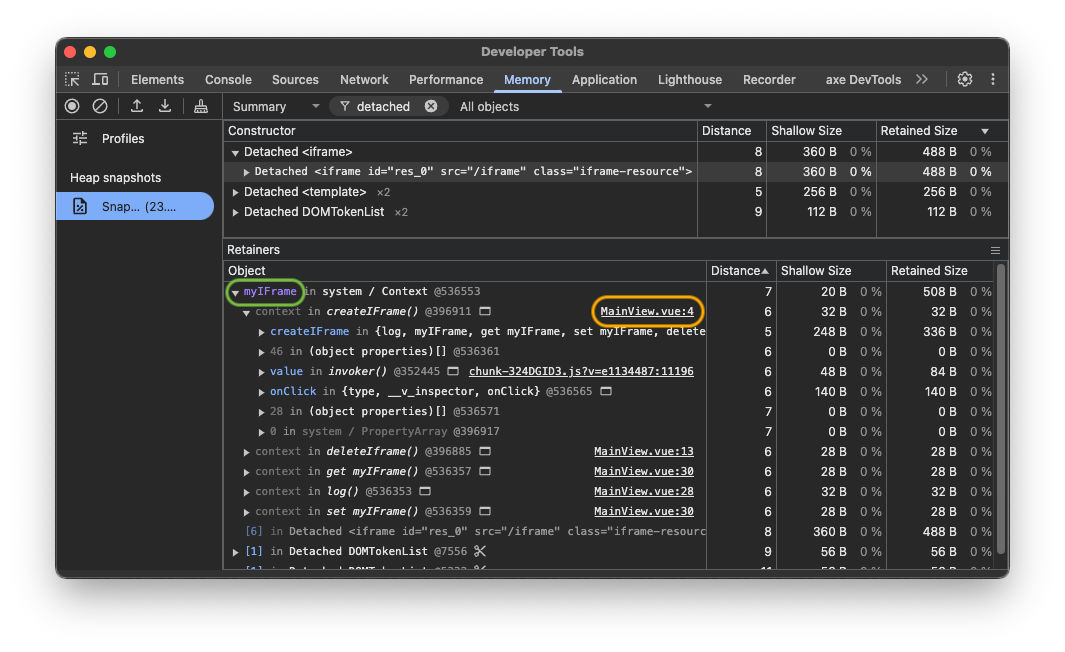
Memory issues in micro-frontends can be identified relatively easily using the Heap Profiler. If an object no longer exists in the DOM but is still retained in memory, it will appear in the Heap Profiler with the prefix “Detached”. Using the filter, you can easily search for such objects. When you click on an object, the “Retainers” section at the bottom displays a tree of all elements that hold a reference to the object and are therefore keeping it in memory. This tree can be used to trace the cause of the unreleased iFrame. The Heap Profiler also allows you to jump directly into the source code, making it easy to locate the exact line that holds the reference to the iFrame.
The following two examples show the Heap Profiler in action for an application where, in the first case, an iFrame is retained in memory by a variable, and in the second case, by an event listener.
If there is no reference from another iFrame, it may actually be the DevTools themselves that are retaining objects in memory. To avoid this, it is advisable to keep the DevTools closed while using the application, and only open them when you are ready to take the heap snapshot. Additionally, the browser console should be cleared beforehand. This ensures that no side effects occur during memory analysis.
Conclusion on Memory Leaks
Memory leaks in micro-frontends can easily occur if they are not considered during development. However, with a basic understanding of how the garbage collector works, these issues can be avoided quite effectively. And if memory leaks do occur, they can be analysed and resolved using the right tools — such as the Chrome DevTools.
Your job in development at d.velop is waiting for you!
At d.velop, development isn’t just a job – it’s a passion. We stand behind our code, which we create together with over 200 people in our agile, cross-functional development teams.